
The K-12 System Capacity Crisis (Part 1): When “doing more” stops working
Educators today have access to more resources and better tools than ever before, so why is it harder for school systems to deliver outcomes for their communities?
-
Districts have more resources, tools, and staff than ever before. Student outcomes have declined anyway. The problem is not effort or investment. It is organizational complexity.
Three reinforcing dynamics erode capacity:
Initiative Debt — accumulated programs create exponentially growing complexity
The Perfect Program Myth — swapping programs rather than building the systems to make them work
The Autonomy Trap — autonomy without system design generates fragmentation
Practical complexity grows faster than it appears, accelerating as each program is added. For instance, adding a fifth literacy curriculum increases pairwise interactions by 67%, not 25%.
Districts cannot hire their way out of this. Administrator staffing is up 25% since 2018-19 while enrollment has declined. The path forward is operating better, not doing more.
The typical K-12 school district today has more of everything than it did thirty years ago.
Educators have access to higher quality curricula, more student data, more instructional technology, more accessible professional learning, and more rigorous efficacy research. Per-pupil investment and staffing ratios are at their highest levels ever.[i] Students have more access to educational content within and beyond their school than ever before. Parents have more information about schools and more educational choices for their children.
Yet student outcomes have declined, a trend that started in the years prior to the COVID pandemic.[ii][iii] Educator satisfaction is nearing the lowest levels on record.[iv] Superintendent turnover is growing.
What is preventing educators, who are working harder with better tools than ever, from delivering outcomes for students? School districts have become so organizationally complex that they can no longer reliably translate investments into results. The capacity of our school systems has diminished.
At LearnScope, we believe that K-12 leaders can choose a different path to operate better, and the first step is to understand what created the school system capacity crisis.[v]
The Cost of “Doing More”
For decades, the dominant strategy in K-12 education has been to do more: add a curriculum to improve elementary literacy, a technology tool to increase access to instructional data, a professional learning program for early-career educators.
Each decision made sense on its own, but at some point, doing more no longer improves results. The organization and the people within it become overloaded, and the increased complexity begins to erode capacity.
Diminishing school system capacity can take many forms, but districts typically experience some combination of three reinforcing dynamics.
Initiative Debt
Many districts experience organizational overload from years of accumulated programs, tools, and policies without a clear path to aligning or consolidating them.
Consider a district that has four literacy curricula in place today. They decide to add one new supplemental curriculum to fill a perceived gap. The perceived complexity would suggest an increase of 25% when this district moves from four to five programs, but this assumption hides the interactions of how each program layers on top of one another. The practical complexity requires understanding not just the new program but how it interacts with each of the four already in place. The practical complexity can then be estimated based on the number of pairwise interactions between programs.
In other words, when a district adds a fifth literacy curriculum, there are four new pairwise relationships to manage on top of the six that already existed, which means the district moved from six to ten interactions – a 67% increase – by adding a single program. At ten programs, there are 45 pairwise interactions. At fifteen, there are 105. The complexity grows faster the more programs are already in the system.
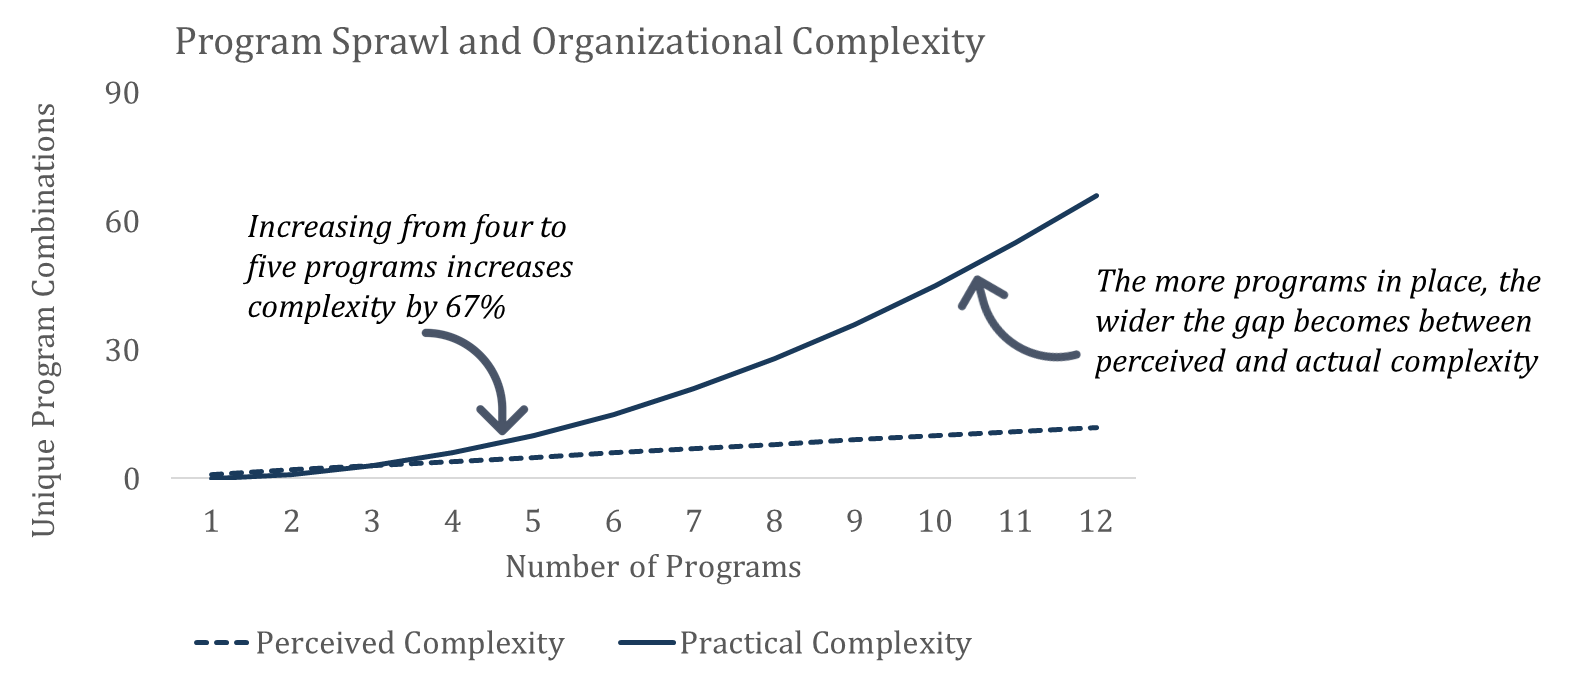
The accelerating complexity growth is especially challenging for the typical district, which relies heavily on layered program delivery.
More than half of all districts use 4+ elementary literacy curricula[vi]
More than one-third of all districts have 4+ middle school math curricula[vii]
Districts now use more than 1,500 unique technology tools per month, on average, a figure that is growing 8-9% annually[viii]
Initiative Debt erodes a district’s ability to provide high-quality support to educators and students because it drastically increases the expertise and bandwidth required to properly manage programs across the district.
In many cases, district leaders can help the educators in their community be more effective by asking them to focus on fewer things, by operating better rather than doing more.
The Perfect Program Myth
Consider a district where elementary literacy scores have been flat. The school board has prioritized this as a critical issue. The most natural move for a leadership team is to look for a different program to produce different results. This is an example of why districts invest heavily in finding the “perfect program,” assuming results will follow. What they do not often consider is that across strong, evidence-based options, program quality varies far less than implementation quality.
A district could choose from several literacy curricula or instructional technology platforms of comparable merits. The variable that will determine whether reading outcomes improve is not whether the district selects between one evidence-based program and another. The variable that matters is whether the district has the organizational infrastructure to translate the program into higher quality support for students and educators, including a clear theory of action, defined decision rights, program management capabilities, and continuous improvement processes.
Without that infrastructure, educators fill in the gaps themselves. They take on de facto decision rights over how to use the program, how to supplement it, and how to assess its impact. With minimal coordination across schools and classrooms, practices fragment across the district. These decentralized decisions drive significant increases in organizational complexity, not because anyone set out to increase complexity, but because the system design defaulted to it.
The Perfect Program Myth feeds directly into Initiative Debt. When the current program does not produce the expected results, the instinct is to search for another program rather than to invest in the organizational conditions that would make the existing one work. Each cycle adds another layer of complexity.
Districts can break free from the Perfect Program Myth by rebalancing their investments, including spending less energy finding the right program and more energy building the system capacity to make any well-chosen program work.
The Autonomy Trap
In many communities, school districts have deployed an “autonomy as strategy” approach in response to traditional bureaucratic rigidity. The idea is that you give principals full autonomy, let teachers own the student experience, and reduce the district’s role to compliance and oversight.
The “autonomy as strategy” approach was a response to real frustration, but it also created a critical tradeoff, especially when deployed without clear guardrails and governance. These systems were designed in a way that often generated complexity rather than system-wide coherence.
Drastically increasing autonomy for principals or teachers provides relief in the short term, including freedom from bureaucratic requirements that feel disconnected from the classroom, but its long-term consequences can be corrosive. Consider a school district with ten elementary schools and two district-level administrators supporting elementary teaching and learning. Each administrator covers five schools. Each school has its own core literacy curriculum and supplemental literacy program, which means the two administrators must develop working fluency in 20 distinct programs, many of which are at least partially homegrown. They also need to understand how the core and supplemental programs interact across as many as 190 pairwise combinations. Add a similar pattern for math content, the unique needs of the students in each classroom, and the skill sets of each individual teacher, and the task becomes unmanageable.
The Autonomy Trap accelerates both of the dynamics above. Autonomy without system design creates the conditions for Initiative Debt to grow unchecked, and it makes the Perfect Program Myth harder to escape because each school is running its own search for the right answer independently.
The issue is not autonomy itself, but rather autonomy without a cohesive system design wrapped around it.
Eroding System Capacity and Growing Administrative Ranks
Each of the three dynamics described above contributes to organizational overload, and in practice they compound one another. Initiative Debt raises the floor of complexity. The Perfect Program Myth keeps adding to it. The Autonomy Trap removes the organizational mechanisms that might otherwise keep it in check.
This overload is often felt acutely by K-12 leaders. Even small changes feel cumbersome and challenging. In response, many district leaders have tried to hire their way out of the problem. Nationally, district administrator staffing levels have increased 25% since 2018-19 even as student enrollment declined.[ix] Unfortunately, this problem will not be solved by throwing more people at it. Even if it could be, superintendents and other district leaders typically do not have visibility into the full range of programs, tools, and practices in place across their school system. You cannot manage complexity you cannot see.
The tragedy of this scenario is that everyone involved wants to provide exceptional support for educators and students. This is not the result of bad intentions but of system design choices that have compounded for decades, and this is not an inevitable equilibrium. District leaders can choose a different path.
Getting Started
The last decade in K-12 education was defined by innovation: new tools, new programs, new instructional models. The next decade will be defined by execution. This shift starts with evidence-based management.
The districts that help their students thrive will be the ones that simplify their systems, align their efforts, and rebuild the capacity to influence outcomes. The path forward is not doing more. It is operating better.
A useful starting point: How many of the programs in your district today could you describe the theory of action for? What about your cabinet members or principals? If the number is lower than you would like, that is not a criticism of your leadership. It is a signal that the system has outgrown its design. In Part 2 of this series, we will lay out a framework for rebuilding system capacity, grounded in the work of real districts delivering exceptional results.
LearnScope is committed to offering support and resources for K-12 leaders as they work to operate better.
Resources
Read “The K-12 System Capacity Crisis (Part 2): Rebuilding School System Capacity” for a practical framework and a detailed case study about how evidence-based management can build School System Capacity
Take LearnScope’s School System Capacity Self-Assessment to understand the strengths and opportunities within your own organization
Sign up for our newsletter for more free resources and insights
Actions
Engage your leadership team and/or principals in a discussion about school system capacity in your community; consider asking each team member to complete the Self-Assessment tool to help calibrate and generate productive discussion
If you are interested in learning more about how LearnScope can help support you and your team, let’s have a conversation!
[i] National Center for Education Statistics, "Table 236.10: Expenditures for Public Elementary and Secondary Education and Other Related Programs, by Function: Selected School Years, 1919–20 Through 2020–21," Digest of Education Statistics 2023, 2024, https://nces.ed.gov/programs/digest/d23/tables/dt23_236.10.asp.
[ii] National Center for Education Statistics, "NAEP Reading: Performance Trends for States and Districts," The Nation's Report Card, 2024, https://www.nationsreportcard.gov/reports/reading/2024/g4_8/state-district-trends/.
[iii] National Center for Education Statistics, "NAEP Mathematics: Performance Trends for States and Districts," The Nation's Report Card, 2024, https://www.nationsreportcard.gov/reports/mathematics/2024/g4_8/state-district-trends/.
[iv] Matthew A. Kraft and Melissa Arnold Lyon, "The Rise and Fall of the Teaching Profession: Prestige, Interest, Preparation, and Satisfaction over the Last Half Century," EdWorkingPaper No. 22-679, Annenberg Institute for School Reform at Brown University, November 2022, https://files.eric.ed.gov/fulltext/ED625927.pdf.
[v] The concept of School System Capacity is adapted from the State Capacity movement, which focuses on improving the effectiveness of government service delivery but typically leaves out education. The work of Jennifer Pahlka, the Niskanen Center, Ezra Klein, and Derek Thompson were all referenced.
[vi] Center for Education Market Dynamics, "The Hidden Complexity of ELA: What Curriculum Combinations Reveal About District Practice," CEMD, July 2025, https://www.cemd.org/wp-content/uploads/2025/07/CEMD_The-Hidden-Complexity-of-ELA_2025.pdf.
[vii] Center for Education Market Dynamics, "The Road to Coherence: Ensuring Alignment Between Core and Supplemental Materials," CEMD, March 2025, https://www.cemd.org/the-road-to-coherence-ensuring-alignment-between-core-and-supplemental-materials/.
[viii] LearnPlatform by Instructure, "The EdTech Top 40: K-12 EdTech Engagement During the 2024-25 School Year," Instructure, 2025, https://www.instructure.com/resources/research-reports/edtech-top40-2025.
[ix] Chad Aldeman, "Staffing Déjà Vu: Districts Add 118,000 More Employees, Serve 135,000 Fewer Kids," The 74, 2026, https://www.the74million.org/article/staffing-deja-vu-districts-add-118000-more-employees-serve-135000-fewer-kids/.
-
Initiative Debt is the accumulated organizational cost of adding programs, tools, and mandates over time without retiring, integrating, or adequately resourcing them. The concept is analogous to technical debt in software development. Each new program adds not just one more thing to manage but a set of new interactions with everything already in place. A district moving from four literacy curricula to five does not increase complexity by 25%; it increases the number of pairwise interactions from six to ten, a 67% jump. More than half of all U.S. districts use four or more elementary literacy curricula, and the average district now uses over 1,500 unique technology tools per month.
-
The Perfect Program Myth is the belief that selecting the right evidence-based program is sufficient to produce improved student outcomes. In practice, the quality difference between strong, evidence-based programs in the same category is far smaller than the difference in implementation quality across districts. A district that lacks clear decision rights, a coherent theory of action, and continuous improvement processes will struggle to produce results regardless of which program it selects. The Perfect Program Myth feeds directly into Initiative Debt because when a program underperforms, the instinct is to replace it with another program rather than to invest in the organizational conditions that would make the current one work.
-
The Autonomy Trap occurs when school districts grant broad autonomy to principals and teachers without establishing the system-level guardrails and governance structures needed to maintain coherence. While autonomy is a response to legitimate frustration with bureaucratic rigidity, deploying it without clear expectations, defined decision rights, and shared priorities tends to generate fragmentation rather than innovation. Each school independently selects its own programs and approaches, which multiplies complexity across the district and makes it nearly impossible for central office staff to provide meaningful, consistent support.
-
Student outcomes in the United States have declined on national assessments even as per-pupil spending, staffing ratios, and access to evidence-based tools have reached historic highs. The core issue is not resources but organizational capacity. Decades of accumulated programs, tools, and mandates have made districts so operationally complex that they can no longer reliably translate investments into results. Three reinforcing dynamics drive this crisis: Initiative Debt raises the baseline level of complexity, the Perfect Program Myth keeps adding to it, and the Autonomy Trap removes the organizational mechanisms that might keep it in check.
-
Hiring alone will not resolve the capacity crisis. Nationally, district administrator staffing levels have increased 25% since 2018-19 even as student enrollment has declined. The challenge is structural, not one of headcount. Even well-staffed districts often lack visibility into the full range of programs and practices operating across their system. Without that visibility, adding more people simply distributes the same unmanageable complexity across more desks.